One of the notes that I keep stuck to my computer reads “remember seasonality”. For those just now becoming familiar with options, you may assume I am reminding myself not to forget deer season or the opening of the season for striper fishing. While these are important dates for many of us to remember, I am reminding myself that there are distinct periods within the options expiration cycle where certain trades work better and give a competitive advantage to the trader who recognizes and takes advantage of this seasonal pattern.
As a quick review, remember that option cycles historically have been established with monthly expiration cycles. For the knowledgeable option trader, different time periods within this monthly cycle are known to have distinct characteristics. The primary reason for these different characteristics is the “non linear” decay of time premium.
This “non linear” behavior simply means that the decay of time premium accelerates as expiration approaches; for us visual thinkers, envision a snowball rolling downhill. The recent arrival of weekly options has opened a whole new concept of seasonality for traders using those vehicles, but that is a discussion for a future time.
The butterfly is one of the option constructions most affected by seasonality. The last two weeks of the monthly option cycle is even called “butterfly season” by many option traders. The classic behavior of butterflies is that they are only slightly impacted by changes in the price of the underlying early in the cycle and exhibit increasing response to price change late in the option cycle. This peculiar functional characteristic has frustrated many traders who have tried to employ butterflies early in the options cycle and have routinely seen the correctly predicted price action result in minimal or no profit in the position.
For those of you unfamiliar with this construction, let’s look at an example. First and foremost, we need to be aware of our position in the cycle. February options expire Friday, February18, this is 17 days from today. That is close enough to the mid point of the cycle to be open season for butterflies.
The essential structure of a butterfly is to establish a spread in either calls or puts that has the structure +1/-2/+1. The spread uses options which all expire in the same month. A variant of the classic butterfly, the iron butterfly, uses both puts and calls but this metallic beast will need to be the subject of another post.
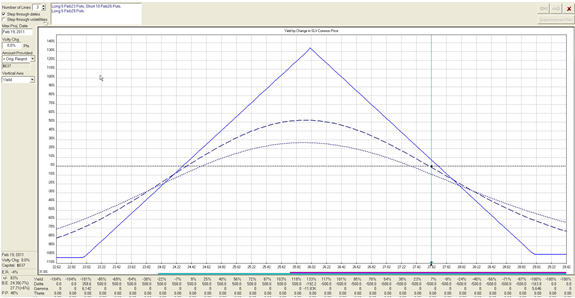
Since a picture is worth “a thousand words”, let’s look at an example of a butterfly structure before we discuss some of the nuances of which the trader must be aware. Now, don’t go out and put this on, it should be used only as an example and not a trade recommendation or financial advice! This trade is to demonstrate the butterfly structure and to lead us to some functional considerations. The trade is that of a put butterfly in SLV.

As you can see the position is slightly bearish, with maximum profit occurring at expiration at the SLV price of 26. For those who are bullish or even neutral, a similar trade could be constructed to reflect that viewpoint. An important point is to notice the difference in the solid blue line, the expiration P&L graph, and the intermediate time frames indicated by the broken lines. As is readily apparent, the sensitivity of the position to price movement is much less at points in time prior to expiration.
A key point to remember when trading butterflies is that maximum profit is ALWAYS when the price of the underlying, in this case SLV, is at the short strike at expiration. By remembering this fundamental characteristic, an option trader can center the butterfly on his projected price target in order to maximize profit.
Another fundamental characteristic of the butterfly construction is that this structure usually works best in an implied volatility environment that is in the upper half of its historic range. What is the reason for this characteristic? The options we sell short in the center of the butterfly represent a major profit engine for the structure. If these options are somewhat “rich”, as indicated by the calculated level of implied volatility, they provide a substantial boost as the time premium we are short decays into expiration.
How does the butterfly under discussion fit into the volatility consideration? Below is the volatility chart for SLV. The brown line is the volatility actually demonstrated in the market recently, and the blue line is the implied volatility calculated from actual option trades. As you can see, we are currently in the mid range of volatility for this underlying. This is a good place to be for an options trade, and provides an additional “tailwind” for the trade together with our current position in the time of the option expiration cycle.

Successful option traders understand the limitations and advantages of the vehicles available to them. The butterfly can deliver outstanding risk/reward scenarios, and the probability of its success is enhanced by understanding the nuances of its use.
Get My Trade Ideas Here: http://www.optionstradingsignals.com/profitable-options-solutions.php
J.W. Jones


